SchemDBG
SchemDBG
SchemDBG is a back-end agnostic debugger front-end that focuses on debugging binaries without access to the source code.
SchemDBG grew from the frustration with reversing in Linux environments (e.G. no proper binary-only-frontends for GDB). Currently, SchemDBG features a plain GDB server back-end and a PIN based back-end running on both 32 and 64 bit binaries in a Ubuntu host. SchemDBG hasn’t been tested with the PIN back-end on a Windows host but the PIN debug server works under windows #17.
The debugger uses a controller written in ruby and a web front-end written in coffee-script. Currently, the front-end will only work properly in Chromium and it is not planned to support other browsers.
Vision
A debugger for reversing
The debugger is not meant to be used to debug your own code where you have access to the source code. It is meant to be used for disassembling binaries. This has a range of consequences, during debugging one might encounter self-modifying code, anti debugging techniques, handwritten assembly, … And there is very little help in understanding the behavior in form of debug symbols. That’s why SchemDBG will have to make the most out of the available information.
Display as much information as possible
A debugger should focus on making as much information available to the user as
possible at any point in time. Schem tries to achieve this in various ways. The most
obvious one would be how it handles labels. Instead of plain old strings it can
add arbitrary data to a label. Additionally, a label is not just pointing at one
byte in memory but describes a whole address range. To make this explicit they
were named tags instead of labels. Tags containing type information are
used in any of the mayor views (stack, memory, CPU). Other use cases are
displaying information such as allocation origin, heap information, inferred
C++ class vtables or any other information that can be extracted.
One is able to create as many different views in any layout one wishes to using only a simple HTML file with stub divs. Many clients can connect to the same controller which trivially allows to have custom multi-monitor setups.
Make the tool back-end agnostic
There is a vast amount of different debuggers out there. SchemDBG tries to make it quite simple to implement custom back-ends for our front-end (and maybe even custom debuggers). Therefore, the actual debugger is decoupled from the front-end. If you choose to implement an own debugger back-end you will only have to create a class that implements basic memory read/write, register read/write, step, break point, run, and a function that lists mapped memory ranges / loaded images. Currently, Schem has a gdbserver back-end and a back-end that connects to any PIN tool.
Make scripting possible
Since the entire controller is written in ruby, scripting the debugger is quite simple. SchemDBG offers high level APIs so that scripts will not have to rely on low level information such as the underlying debugger back-end or platform. Watch expressions are integrated into the front-end which can run ruby code on every stop. The debugger will spawn a ruby REPL (pry) which has full access to any aspect of the debugger. For the future it is planned to add another class of plugins which can be used to automatize may aspects of reversing.
Make teamwork/integration possible
Current tools make interacting with team members working on the same binary very complicated if not impossible. Schem will try to make sharing of any inferred information as painless as possible. Originally, it was planned to facilitate this by using a redis database to store all relevant information. However, during the actual development the database was used very sparsely and Schem is now in need of a means of additional interaction. For example, in the future it should be possible to import type information, etc. from IDA.
Features
Memory view
Memory views supporting types and inline display of additional data. This is helpful if used with custom PIN instrumentations that infer additional information such as “where was this memory allocated”. Additionally, the user can add type information to any part of the memory. While there is a POC implementation that can be used to increment 1/2/4/8 byte integers, there is no proper way to modify memory in meaningful ways.
Changing types in memory view
Register view
Registers can contain sub-registers which will be displayed in a tree like structure. Special registers will currently only be displayed without proper formatting and with no ability to edit them.
Editing regsiters
Taking a jump by changing flags
Stack view
The stack view is currently rather simple and will only display the WORDS above the stack pointer. In upcoming releases more information will be added to this such as displaying the stack frames and function arguments in the stack view.
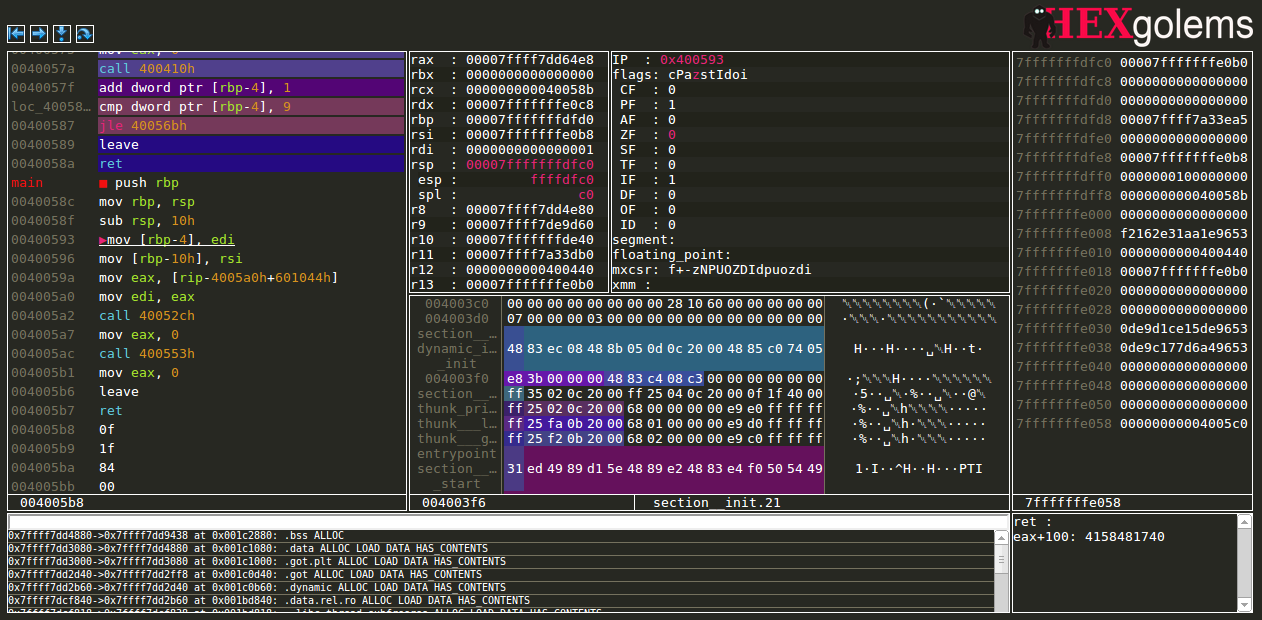
Code view
The code view contains a syntax-highlighted disassembly of the code. Hovering opcodes will display a short description of the instruction. Using the same mechanism as the memory view (after all they share most of their code) the CPU view displays additional data. Static strings are displayed as strings and basic blocks that were identified by the disassembler are colored in such a way that it is easy to see where a basic block begins and ends. For disassembly, the controller generates a static mapping that contains the type information of any section in the binary. To do so the binary is disassembled with the Metasm library. This type information can be updated at run time to handle self modifying code. Not yet implemented is the ability to patch the code at run time with new assembly and display jump paths. Additionally, currently addresses are always displayed as addresses, but in the future labels will be used, if they are available.
Adding and deleting breakpoints
Entering and leaving functions
Goto label and adding a new label
Expression View
The expression view allows the user to evaluate given ruby snippet on every stop to supply her/him with up-to-date information whenever the debugger stops.
Adding a watch expression
Disassembly
Currently, Schem relies on the disassembly provided by Metasm in the
fast_deep mode. If the binary is obfuscated it would be reasonable to use the
slower mode that will symbolically evaluate stack modifications of functions.
Additionally, Schem relies on the data structures returned by Metasm. It is
planned to reduce coupling between our code and the Metasm library such that different platforms can be used more easily (it would be relatively
easy to add support for MIPS and PPC since Metasm support them out of the
box). All disassembly information is stored in a per-section static type
mapping. This mapping can be modified easily by the front-end or other tools but
the format should be better documented.
Controller
The controller mainly consists of services and plugins. Plugins will be
started in their own thread, while services will only provide functionality.
One example for a service is the tag service which contains the dynamically added
tags. It is registered as srv.tags and can be used from any other
plugin/service. It features the ability to dynamically create, delete and query
tags for any address range. One example for a plugin would be the CPU view
plugin. It is a web plugin (the only kind of plugins currently used). This means
that a new instance can be created by a web-socket request to a special URL. The
instance is then linked to the web-socket connection. The CPUViewPlugin will
then provide the front-end with rendered HTML strings that are displayed as well
as event handlers for context menu actions.
Installation
sudo apt-get install gitgit clone https://github.com/hexgolems/schem.git- get ruby1.9.3 - either via rvm or do the following:
sudo apt-get install ruby1.9.1 ruby1.9.1-dev g++
Yes, it installs ruby1.9.3, blame debian/ubuntu for that naming fuckup. cd schem/controller; ruby make.rb setup
- if you are using ruby via rvm then you don’t need root to install gems and please answer with “n” if you are asked whether you want to install with root
- if you are using ruby from the debian/ubuntu sources then you need root to install the gems so please answer with “y”
- make sure all the gems installed correctly, if not figure out why and install them (if you didn’t use rvm, pleaes check the known issues!)
- now we need to compile the front-end from coffescript to javascript
cd schem/frontend; ruby make.rb build cd schem/controller/lib; ruby controller.rb -p ../run -b gdb- open chromium and visit 127.0.0.1:8000
- if you run into trouble join our IRC channel: Freenode/#hexgolems!
- ???
- profit