On Measuring and Visualizing Fuzzer Performance
On Measuring and Visualizing Fuzzer Performance
Measuring the effectiveness of fuzzers is inherently challenging. Yet it’s extremely useful in different use cases: It is needed to test one’s own fuzzers during development or during a software audit and to prove the usefulness of new techniques introduced by both private and academic researchers.
After recent public discussions on some of the pros andcons of current practices, we propose to measure coverage based on a small random sample of all inputs generated by the fuzzer instead of the final queue. Using a random sample of inputs, we can get a much more detailed picture on what parts of the program a fuzzer is exploring properly and which not. We hope this will be helpful for debugging new fuzzers, and ideally lead to better evaluation of fuzzing in the future.
Existing Metrics
Unsurprisingly there is no lack of different opinions on evaluating fuzzers, so we will be giving a quick recap of their advantages and disadvantages. The most prominent (non-idiotic1) metrics currently used are:
-
Measure number of new manually triaged bugs
-
Measure time to trigger known bugs
-
Measure new code coverage
Needless to say, all of these approaches have significant downsides:
Of course, finding new bugs is great, but It’s not a very fine-grained metric to judge progress by. If I’m debugging my own fuzzer and It’s not (yet) finding bugs, it’s not helpful to look at the number of new bugs found. If it found bugs, the job is done and it is no longer that helpful. To make the matter worse, many fuzzers will find hundreds and thousands of “unique crashes” that only represent a single real bug. Hence, to obtain a useful metric, a significant manual triaging effort is needed. For academic papers, it’s almost useless, as it is more of an indicator of “We spend some students’ time on fuzzing a large number of shitty targets” than an indicator of “the fuzzer is actually any good”. If we were to use a stronger version such as “find new bugs in WELL FUZZED targets” to avoid this issue, a significant number of useful techniques will not be able to demonstrate usefulness. For example, if you are increasing the execution throughput by a factor of 10x, it’s still unlikely that your project is able to uncover a singificant number of bugs: Google has many thousand cores fuzzing 24/7 for years and a lot of security researcher out there spend days and weeks to get proper seeds, dictionaries and grammars for most well fuzzed targets. As such, it is typically necessary to build a new fuzzer with a significantly different distribution of inputs to find really interesting new crashes.
Evaluating on known bugs is useful if you are working to build a new fuzzer for a target that you already understand reasonably well. If you have manually inspected other bugs previously, and want to make sure that your fuzzer works as expected, it’s an excellent sanity check. However, I think it’s almost useless for academics, as the number of data sets with known bugs is very limited, and there have been significant cases of over fitting for the given data sets (LAVA-M, I’m looking at you).
Over the last years, we strongly advocated for code coverage as a primary evaluation metric for a variety of reasons. There is strong evidence that coverage guided fuzzers are VERY effective at finding bugs, and such fuzzers do not find bugs in code that wasn’t covered. If the fuzzer has no access to seed files, the ability to find new code coverage is also an excellent predictor for the fuzzers ability to solve difficult constraints in the program to reach more and more code. The same ability will help the fuzzer explore distinct areas of the state space. This advantage remains even when good seeds are available, but the effect becomes less visible in commonly used metrics. Code coverage is also rather fine-grained and can be easily measured, inspected and understood. However, there are many approaches where code coverage is hard to obtain (blind fuzzing, symbolic approaches) and there are common cases where it might be misleading. For example, with grammar fuzzers, the grammar might only test a very limited subset of the target. Consequently, it will usually be vastly more thorough at testing this area than an AFL-style fuzzer that explores more of the target. Additionally, at least in the large scale FuzzBench Benchmark, nearly all fuzzers show almost identical code coverage. This becomes even more of an issue if proper seeds are used that already produce significant coverage.
Goals for a Better Metrics
After talking about some of the shortcomings of current approaches, let us talk about some of the criteria we can use to judge whether a given metric/approach is useful to evaluate fuzzers.
-
It needs to be fine-grained enough to provide reasonable indicators of progress. Ideally, it should be able to show how well individual lines of the code base have been explored beyond the simple yes/no that code coverage provides.
-
It needs to work across a very large set of complex real world targets to avoid over-fitting. Ideally, it should be trivial to use it on new targets without additional work.
-
Ideally, it should be able to compare results across different types of fuzzers (coverage-guided/blind fuzzers and symbolic based tools).
-
And last but not least, the big elephant in the room: It has to strongly correlate with the ability to find bugs.
In the following I would like to introduce some ideas that I believe could guide the development process of future evaluation metrics.
Designing better Metrics
To address the shortcomings of current metrics and to satisfy the goals stated in the last section, we now propose an initial design for evaluation experiments.
In particular, we would like to stop using the queue to evaluate fuzzers and propose to use a sampling based approach to collect data for measurements. Building on that, we propose some refinements to simple code coverage that will give a much more detailed picture of the fuzzer’s performance.
Methods to Collect Data
Right now, it’s very common to inspect the inputs stored in the queue to measure the coverage gained by the fuzzer. This approach has some significant disadvantages: Most obviously, it’s very hard to compare against fuzzers that don’t have a queue or periodically remove entries from the queue. In the past we sometimes got around this by adding (unused) coverage feedback and a queue to a blind fuzzers for evaluation purposes. However, this is obviously suboptimal - the blind fuzzer pays the performance penalty of coverage measurement without any of the gains. Furthermore, this approach doesn’t even allow us to measure how often (even approximately) a given line was exercised by the fuzzer. We strongly believe that lines which are tested only once or twice are almost as untested as lines that were never tested. At the same time, we observed that many lines only appear in a single input in the corpus, even if they have been tested many thousand times.
Even worse, it’s entirely impossible to gain deeper insight from this data (e.g. what kinds of values were explored at given points in the target).
Sampling Profilers and Fuzzing Measurements
To avoid these problems, we propose to draw a random sample of the test cases generated during the fuzzing. Storing one randomly picked input a few times per second will not greatly affect the overall fuzzing performance, while giving us a much more precise picture of what the fuzzer is doing. Like a sampling profiler, this approach will very quickly point out which areas are explored thoroughly and which are not. Unfortunately, this introduces some additional random noise, that we will have to mitigate by running multiple experiments in parallel. However, we will need to do this anyway as fuzzer performance can depend significantly on the seed used. However, sampling from all inputs generated has some very nice properties: It produces comparable results no matter how the fuzzer uses coverage, its queue, what scheduling algorithms are used, nor how much attention is paid to each individual entry. If we investigate how much of the state space a fuzzer explored, this approach produces unbiased results. Inspecting the queue heavily biases such metrics towards the first input that reaches a given line of code, and will thus strongly underestimate the diversity in the inputs generated. In fact, sampling even produces comparable results when measuring blind fuzzers.
A Better Code Coverage
The big issues with measuring code coverage is that it doesn’t always correspond to the fuzzer’s ability to cover interesting states. Consider a fuzzer that only reaches a given point once vs a fuzzer that reaches the same basic block over and over again. While both would yield the same test coverage, we would expect the second one to be much more likely to trigger a bug in the target. Consider the (fake but in our experience quite realistic) result from running a structured blind fuzzer and a structured coverage guided fuzzer in Figure 1.
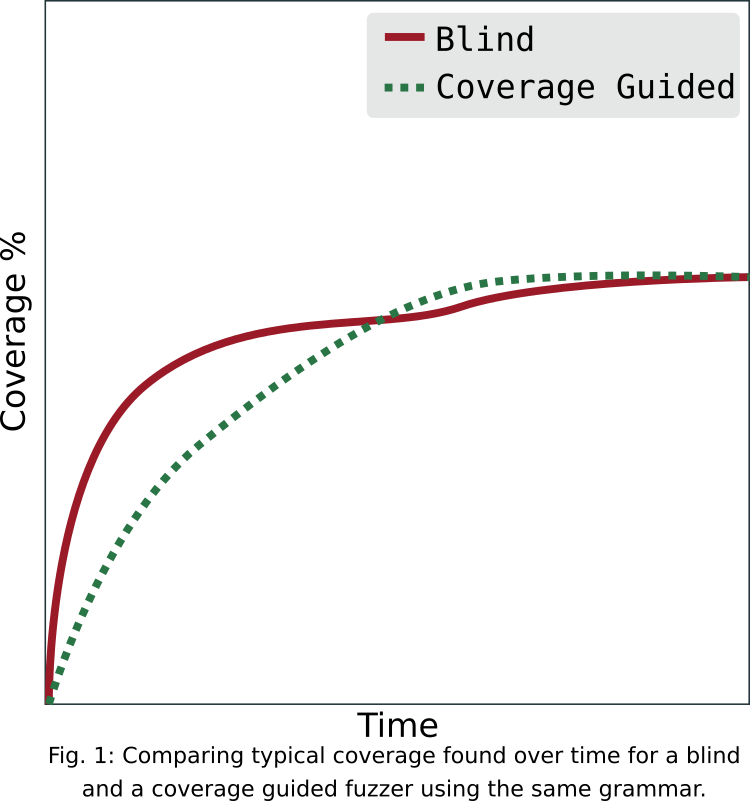
While the blind fuzzer initially performs better due to the reduced overhead, it will take a lot longer to reach the same overall coverage. If we have a look at the basic blocks that are covered only after some minutes to hours, we would expect that the fuzzer continues to exercise the same block sparsely (every few minutes). A coverage guided fuzzer will reliably trigger the same coverage many thousands of times after first finding it. However, in current measurements similar to Figure 1, (such as the ones we did in our Nautilus paper), this would be considered an equal outcome.
We propose to enrich the result by comparing the number of times any basic block was executed during the whole campaign.
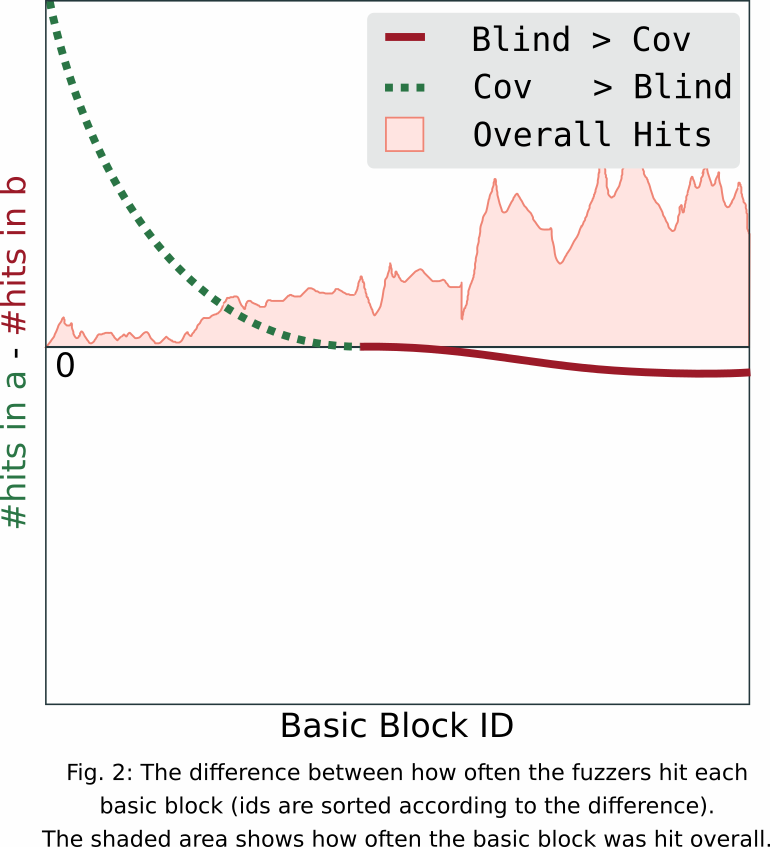
Using a sampling based measurement, we can count how often individual basic blocks were hit by any input. This would give a much more precise view of the real test coverage of a fuzzer. To compare two fuzzers, one can simply create a plot of the differences in counts per basic block as seen in Figure. 2. For interpretability, we added a proportional shaded area that displays how often each basic block was executed overall. Again, the plot is obviously fake. None the less, we could tell that the feedback fuzzer is much better at exploring uncommon basic blocks. Even if Figure 1. showed that they reach the same overall coverage eventually.
Measuring State Coverage
Inspecting differences in effective coverage already helps to identify how different fuzzers explore the code. However, the same approach can be extended to get a much more detailed look into the behavior of fuzzers. For example. Instead of looking at the number of test cases that hit each basic block, we can look at the number of distinct paths that the application took to reach this basic block. Again, we would expect to see that structure aware fuzzers will be much better at triggering the same coverage in vastly different ways. Bitflipper-style fuzzers will have more difficulties to find completely distinct paths reaching the same basic block deep in the application. Additionally, this approach will still distinguish the fuzzer’s ability to uncover distinct paths - even in the presence of excellent seed files.
We can easily increase the precision further: We could inspect the number of distinct values that variables take during the fuzzing process (If the number grows too large, HyperLogLog will probably come handy).
All of this information can be easily aggregated and even displayed on top of the source code of the target to give a much better feeling for how well each fuzzer does in each individual part of the target program.
Call for Action
We believe this approach will serve to increase the ability to compare the performance of different fuzzers. Specifically, it meets three of our four goals: Sampling based evaluation is fine grained, works for real world software and can be used to compare very different fuzzers, including fuzzers using concolic execution to uncover new coverage. However it will not be able to properly represent the strength of fuzzers that use advanced analytics such as symbolic execution to directly trigger bugs without random exploration of the state space. And of course, while we strongly believe that a fuzzer that explores different program states more thoroughly will actually find more bugs, we did not actually prove this yet.
If you have any feedback or ideas for better evaluation metrics, please join the discussion at the Awesome Fuzzing Discord or contact the authors directly via email or on twitter (@is_eqv and @ms_s3c).
-
We will not go into details of why measurements such as number of paths found, number of unique crashes, bugs in LAVA-M etc. are misleading at best. We realize they are widely used, but they really shouldn’t be. Please don’t use them, and watch any of Brandon Falk’s fun rants if you don’t see what’s wrong with those. ↩︎